Collection Spotlight: MarketLine
By Stephanie JH McReynolds, Librarian for Business, Management, and Entrepreneurship
MarketLine features unique digital tools for analyzing and visualizing data on companies, deals, industries, country and city statistics, and social media mentions worldwide. While this database contains numerous industry and related reports that can be keyword searched and downloaded in PDF and Word formats, as well as company lists, deals (such as mergers and acquisitions), and more business and industry related data that can be downloaded in CSV and Excel formats, its dashboards and analytics offer powerful ways to work with and visualize the data within the platform.
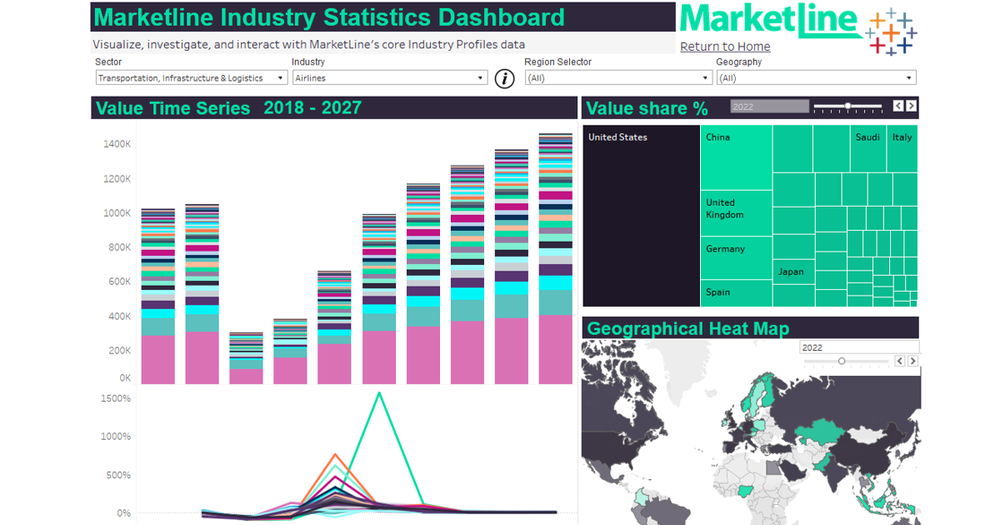
For example, the three Industry Statistics dashboards, Values, Volumes, and Segmentation, provide charts and visualizations of Marketline’s core Industry Profiles data. On the Values Dashboard, you can select an industry sector, an industry within that sector, a region, and one or more geographies (countries) within that region. Each selection you make changes the visualizations of the Value Time Series, Value Share %, Growth Rate, and Geographical Heat Map. If you want to save your visualizations, you can export to CSV, Excel, PDF, PNG, or PowerPoint.
City Statistics and Country Statistics offer even more selections and interactive visualizations than Industry Statistics, with City Statistics covering “key socio and macroeconomic indicators for more than 3,000 cities spread across Asia-Pacific, Europe, Middle East & Africa, North America, and South America” and Country Statistics offering macroeconomic indicators and “consumer demographics, incomes, and expenditures” for over 200 countries.
Social Media Analytics features interactive charts for mentions of concepts, keywords, themes, companies, hashtags and more. You can create word clouds of concepts within Emerging Trends, see a map of Top Locations by Mentions, and view influencer stats, such as Top Contributors.
To explore these and other interactive MarketLine digital tools, click on Browse by Content Type or Browse by Database within MarketLine. Short video tutorials are also available. To provide feedback or suggest a title to add to the collection, please complete the Resource Feedback Form.