Collection Spotlight: SAGE Research Methods: Data Visualization

by Patrick Williams, Lead Librarian for Digital and Open Scholarship
We are pleased to provide access to SAGE Research Methods: Data Visualization, a new module from SAGE that presents users with a variety of content and features to assist in the creation of compelling and impactful data visualizations. As students and scholars from all around the University respond to the increased attention to data of all kinds in their research disciplines, SAGE Research Methods: Data Visualization offers a suite of resources to enhance the visualization skills of beginners and experts alike.
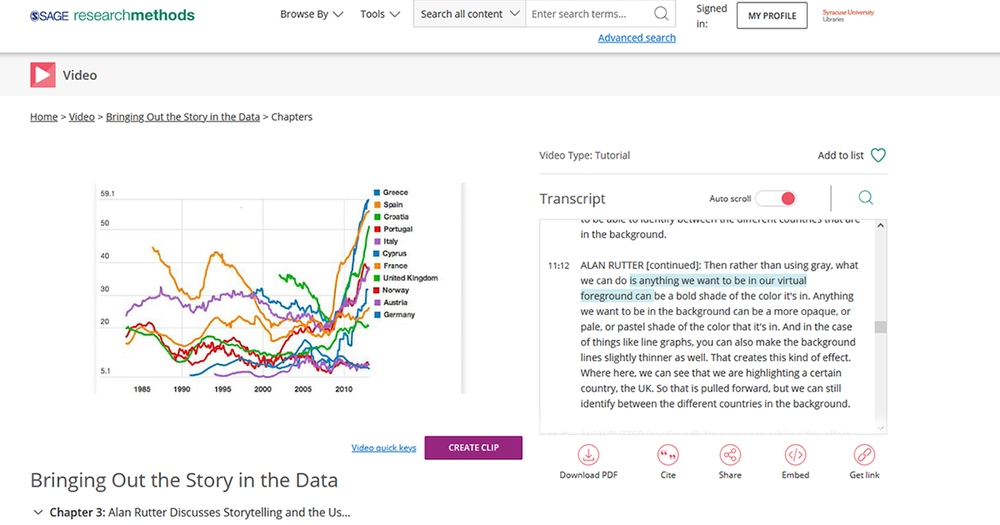
Presented with pedagogy in mind, SAGE Research Methods: Data Visualization is organized to introduce users to the fundamental principles of graphical displays of data—complete with annotated examples across an array of categories—presented with tips and tricks, as well as explanatory examples of bad practice. The platform’s approach is designed to engage users with dozens of captioned, searchable instructional videos covering all aspects of data visualization from basics to advanced topics.
Not only does SAGE Research Methods: Data Visualization present information to users in a clear and intentional way, but SAGE offers high-quality, clean datasets and step-by-step activities for putting data visualization principles and practices to work. Users can develop and test their skills with diverse and authentic data artifacts, and SAGE Research Methods: Data Visualization even assists users in choosing appropriate tools for analysis via their overview materials for more than 75 visualization tools including Python, R, and Excel.
To learn more, visit SAGE Research Methods: Data Visualization (SU NetID required) and begin exploring videos, browsing the different types charts and graphs, or digging in to a dataset. To provide feedback or suggest a title to add to the collection, please complete the Resource Feedback Form.
